Download and analyze Amplify Hosting access logs
Amplify Hosting has no ready-made analytics
AWS Amplify Hosting is good for running a static site, but it doesn’t do analytics.
That means it doesn’t offer easy insights into visitor traffic or behavior.
It does share access logs from which you can build your own analytics.
Acquiring the access logs is a complicated process, and I learned so much while figuring it out that I need to write a series of articles to explain it all.
In this first article I describe a basic solution and provide some missing documentation for the Amplify Hosting service.
In a future article I’ll present a complete solution to download all available access logs and show the queries I use to analyze my own site’s performance.
Read access logs in the console … or don’t
The short story here is you don’t use the console. The experience is so bad it almost made me give up on Amplify. Cloudflare Pages was about to win my business.
In the AWS console you go to the Amplify app, then go to the monitoring page, and then to the access logs tab.
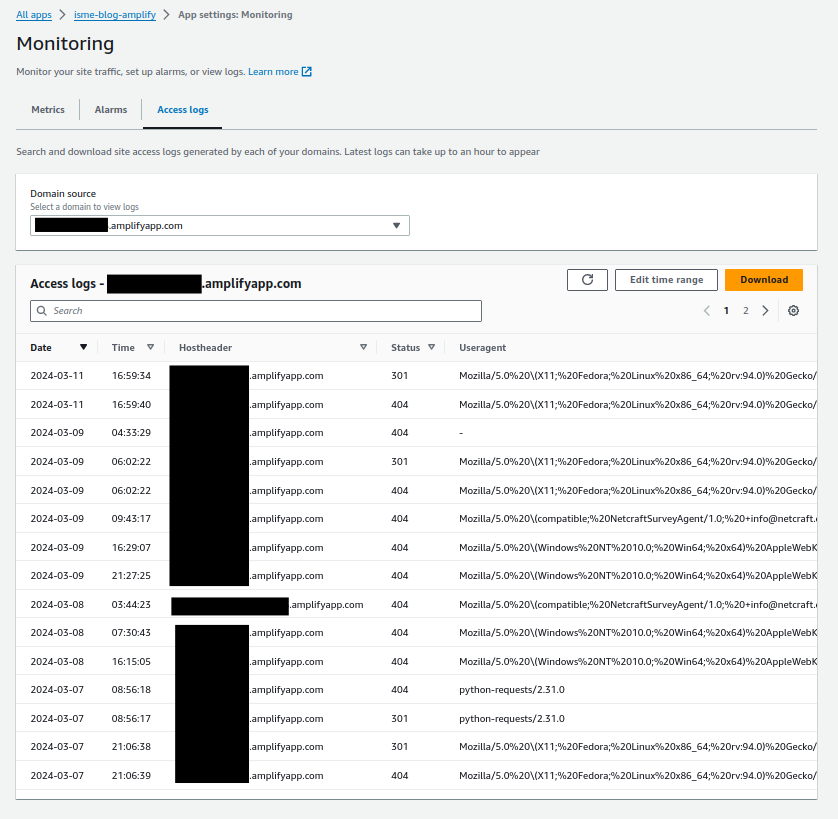
Then you get frustrated because you realise the view is close to useless for analysis.
15 records per page? Give me 100 at least.
Only 4 columns? The full format contains over 30 fields.
It’s as if the service team ran out of time to finish this feature or they don’t want you to use it. Am I missing something?
It gets worse when you click “Edit time range”.
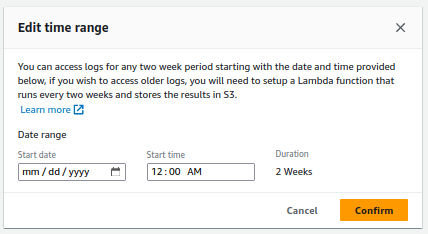
You can access logs for any two week period starting with the date and time provided below. If you wish to access older logs, you will need to setup a Lambda function that runs every two weeks and stores the results in S3.
Did AWS just tell me to write a distributed map reduce function in Erlang?
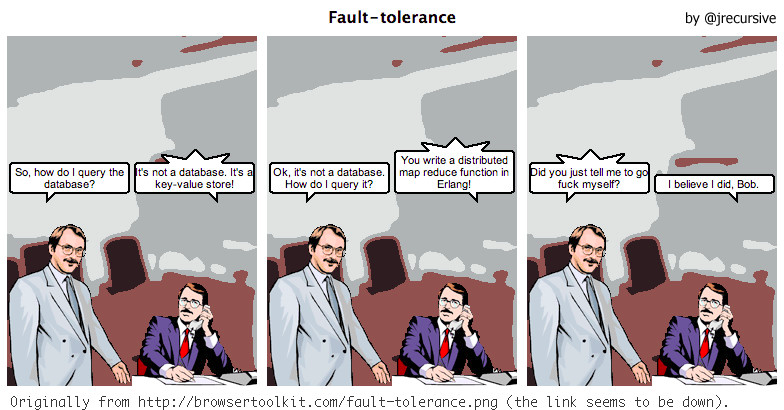
Download the access logs with the GenerateAccessLogs API
So what can you do? If you’re like me, you’ll try to write a Bash script to automate around the problem.
The Amplify user guide’s Monitoring page reassures us that Amplify Hosting retains all access logs for an app until you delete the app, and repeats the console’s limitations. It doesn’t refer to any API to collect the logs.
The API exists. Use GenerateAccessLogs to reproduce the console’s functionality, with all its limitations. In a future article I’ll show how to automate around it to build the log export feature you wish existed. Here I’ll show the basic solution.
You call the API with your app ID, your domain name, and the access time range in ISO format.
aws amplify generate-access-logs \
--app-id dddamplifyapp1 \
--domain-name example.org \
--start-time '2024-03-09T00:00:00' \
--end-time '2024-03-10T00:00:00'
Amplify Hosting responds with a signed URL to an object in an S3 bucket. I redacted the sensitive values in the signed URL’s common parameters.
{
    "logUrl": "https://
               aws-amplify-prod-eu-west-1-access-logs
               .s3.eu-west-1.amazonaws.com
               /dddamplifyapp1
               /example.org
               /Sat%20Mar%2009%2022%3A41%3A50%20UTC%202024
               ?X-Amz-Security-Token=...
               &X-Amz-Algorithm=AWS4-HMAC-SHA256
               &X-Amz-Date=20240313T213714Z
               &X-Amz-SignedHeaders=host
               &X-Amz-Expires=3599
               &X-Amz-Credential=ASIA...%2Feu-west-1%2Fs3%2Faws4_request
               &X-Amz-Signature=..."
}
The Amplify Hosting service owns the log file bucket. It appears to generate the object on demand.
You have an hour to request the URL before the credentials expire. If you request within that time, S3 responds with a chunk of the access log. Keep reading to see how to request it with curl.
The Amplify Hosting log format has quirks
Amplify Hosting is a layer above a range of AWS services including CloudFront, AWS’s content distribution network (CDN) that serves the site content.
Amplify Hosting creates a CloudFront distribution dedicated to your app. You have no direct access to the distribution because Amplify Hosting hides it from you. CloudFront provides Amplify Hosting with its access logs.
But the format that Amplify Hosting shares via the GenerateAccessLogs API isn’t identical to CloudFront’s standard log format. Amplify Hosting has small differences.
The key format is <app_id>/<domain>/<timestamp>.
After URL-decoding the example timestamp is Sat Mar 09 22:41:50 UTC 2024. That’s a weird format. Why is the year apart from the month and date? Why not use the ISO format?
The timestamp marks the first time you request the chunk. Days later if you request the same chunk you get the same key.
The log file format contains not tab-separated but comma-separated values (CSV).
Despite those differences I’m able to analyze the logs with any tool that reads the CSV format.
The S3Stat and GoAccess tools promise ready-made analytics for CloudFront logs. I haven’t yet tested these so I don’t know whether they handle Amplify’s variant.
Now you can automate the log collection
To fetch just one chunk of the logs you complete three main steps:
- Make the
GenerateAccessLogsrequest - Extract the
logUrlvalue from the response - Download the log file at the URL
You can automate all these steps in Bash with a command like this:
curl "$(
  aws amplify generate-access-logs \
  --app-id dddamplifyapp1 \
  --domain-name example.org \
  --start-time '2024-03-08T00:00:00' \
  --end-time '2024-03-09T00:00:00' \
  | jq -r '.logUrl'
)" \
> logs.csv
First the aws command runs. This is the same as before.
| jq -r '.logUrl' passes aws’s output through the JSON processor jq to extract the logUrl value from the JSON response. The -r switch writes the “raw” value, without the quotes that normally surround a JSON string.
"$(...)"' is a command substitution. The output I just described is collected into a Bash string and used as a parameter for what comes next as if it were a literal.
So you can imagine that at this point the command becomes the much simpler:
curl "https://..." > logs.csv
curl requests the content at the URL and just writes it out.
> logs.csv saves the content to a log file with the standard CSV file extension.
Now you just have a CSV file, so you can use your favorite tool to analyze these.
My current favorite tool is DuckDB. My love for DuckDB deserves its own article. Here I’ll just show the commands to do the simplest analysis.
Read the CSV into a SQL table and start the DuckDB CLI.
duckdb -cmd 'CREATE TABLE logs AS SELECT * FROM logs.csv;'
In SQL, count the requests in the access log.
SELECT COUNT(*) AS request_count FROM logs;
Avoid common errors from GenerateAccessLogs
The API has no default date range. If you omit one, it gives an error.
aws amplify generate-access-logs \
--app-id dddamplifyapp1 \
--domain-name example.org
An error occurred (BadRequestException) when calling the GenerateAccessLogs operation: Unable to complete request for the given time range, reduce time range and try again
The API fails if you request more than two weeks. Here I request one month.
aws amplify generate-access-logs \
--app-id dddamplifyapp1 \
--domain-name example.org \
--start-time '2024-01-01' \
--end-time '2024-02-01'
An error occurred (BadRequestException) when calling the GenerateAccessLogs operation: Time range must be no greater than 2 weeks
You’re lucky if you can get a full two-week response. The API may fail with what looks like a timeout. The error text is the same as when you omit the time range.
aws amplify generate-access-logs \
--app-id dddamplify1 \
--domain-name example.org \
--start-time '2024-01-01' \
--end-time '2024-01-15'
An error occurred (BadRequestException) when calling the GenerateAccessLogs operation: Unable to complete request for the given time range, reduce time range and try again
I find it’s more reliable to use a range of just one week.
That means a single chunk contains even less data. That’s why you’ll want to read the next article in the series, where I show you how to download all the chunks!
AWS can do better here
I don’t understand why Amplify Hosting puts that straitjacket over the CloudFront logs.
Please, AWS, consider making the console experience more like that of AWS Config Advanced Query or even Athena. Those services show all the available columns and more than 15 rows.
Even better, consider making the CloudFront access logs directly accessible so I don’t need to spend my evenings and weekends figuring out a custom solution for this! Even if I had to pay for the storage or the requests, it would be a preferable solution, because I could go straight to Athena to derive insights from my data.
Conclusion
In this article I explained showed you how to download and analyze Amplify Hosting access logs.
I started by explaining that Amplify Hosting provides no analytics features. I showed how it’s impractical to use the console to read the access logs and, how it’s difficult to download more than two weeks of log data.
I introduced the GenerateAccessLogs API that allows you to collect the access logs using the CLI, explained the format of the response, and explained the format of the log file and how it varies from the CloudFront standard log file format.
I showed how to use Bash to automate the collection of a single chunk of the access logs and how to analyze the result using DuckDB. I shows some common errors and what you need to do to avoid them.
Before I finished, I shared my opinion on how AWS can improve this experience from the Amplify Hosting service.
Finally I promised in the next article to show you how to go beyond the basic solution to download all the access logs.
Read Denis Gladkikh’s solution
After I started writing this, I found Denis Gladkikh’s blog series on Analyzing AWS Amplify Access Logs. It identifies the same problem with Amplify, proposes a similar solution, gives a tour of the different analytics tools you can use on the logs. I recommend you read these too!